
Xdebug helper最新版是一款可以与Zend Studio、WAMPSERVER协同工作的PHP chrome调试插件,Xdebug helperc:php调试插件是PHP CHROME调试插件,Xdebug helper正式版能够帮助用户调试、分析和扩展Xdebug跟踪,还可以与Zend Studio、WAMPSERVER协同工作。
Xdebug helper开发背景
Xdebug helperc:php调试插件正式版是一款与Zend Studio、WAMPSERVER协同工作的PHP chrome调试插件。做php开发都会用xdebug,但是自从安装了xdebug后,发现每次调试都需要从eclipse中先从头启动,然后一步步走到你要调试的页面,而不是说想什么时候调试就什么时候调试。之前用zenddebugger的时候则是可以在任意页面启动调试,直接从浏览器通知开发环境需要调试。而不用先从开发环境启动调试。随时需要调试的时候就可以执行调试。这个时候就需要一款chrome浏览器有一款插件叫xdebug helper。此扩展对于PHP开发人员非常有用,PHP开发人员使用带有Xdebug支持的PHP工具,如PHPStorm,Eclipse with PDT,Netbeans和MacGDBp或任何其他Xdebug兼容性分析工具,如KCacheGrind,WinCacheGrind或Webgrind。默认情况下,扩展程序图标将显示在所有页面上,但要尽可能保持浏览器清洁,可以将扩展程序配置为仅在设置面板中显示您想要的页面。
Xdebug helper安装方法
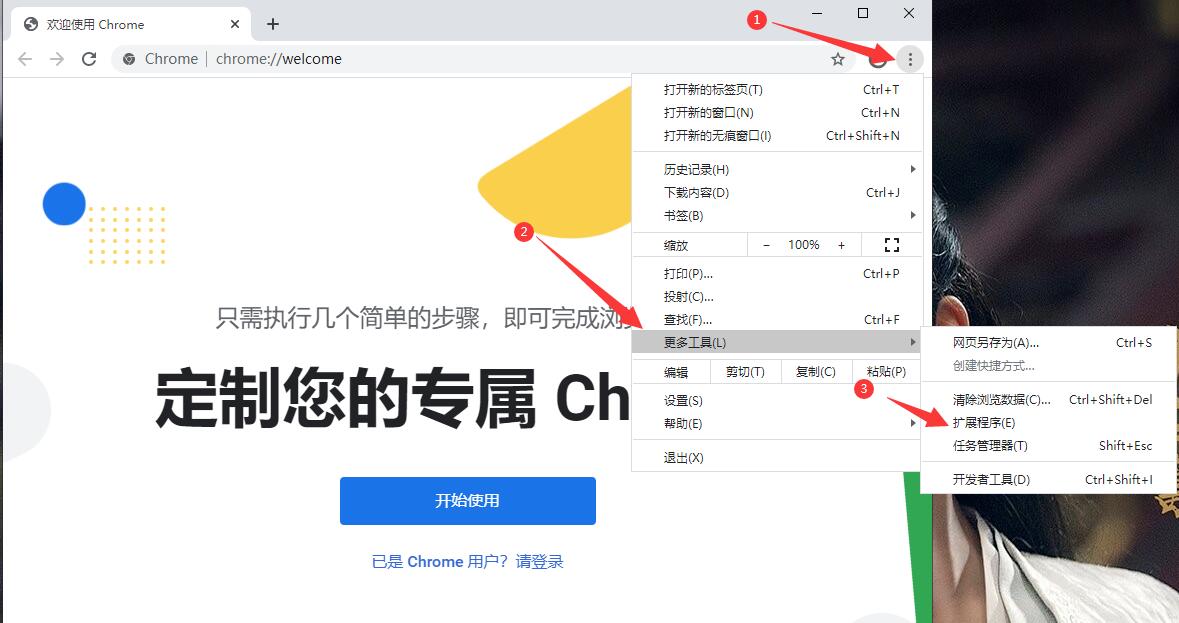
1.首先用户点击浏览器右上角的自定义及控制按钮,在下拉框中选择更多工具选项,然后点击扩展程序来进入Chrome浏览器的扩展管理器页面。
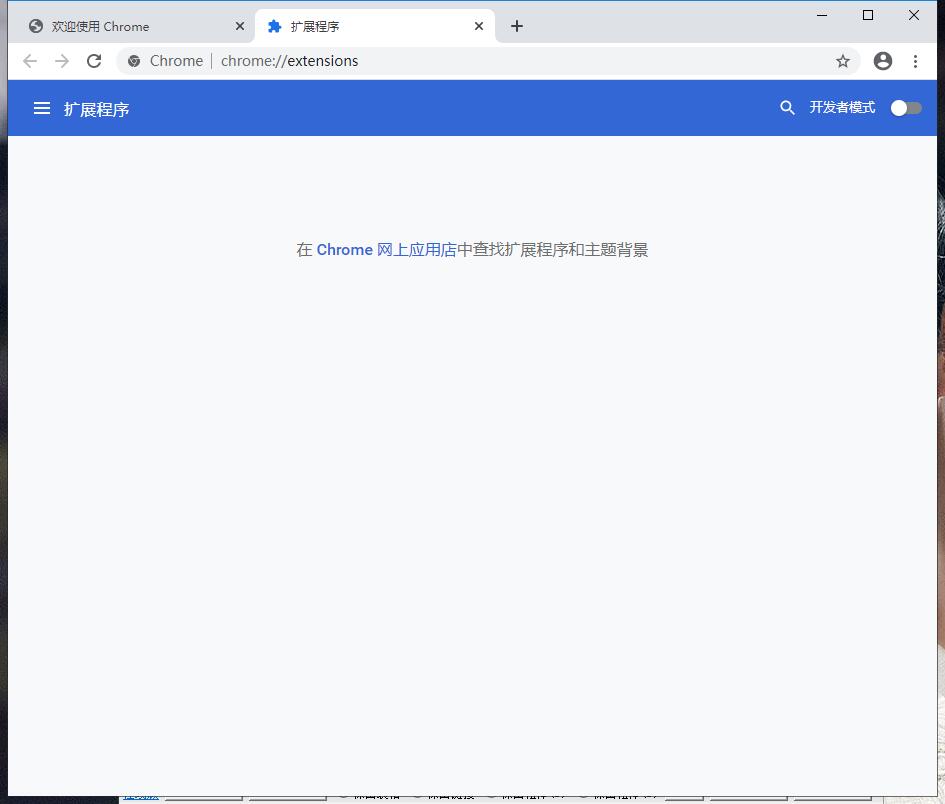
2.在打开的谷歌浏览器的扩展管理器中用户可以看到一些已经安装程序的Chrome插件,或者一个Chrome插件也没有。
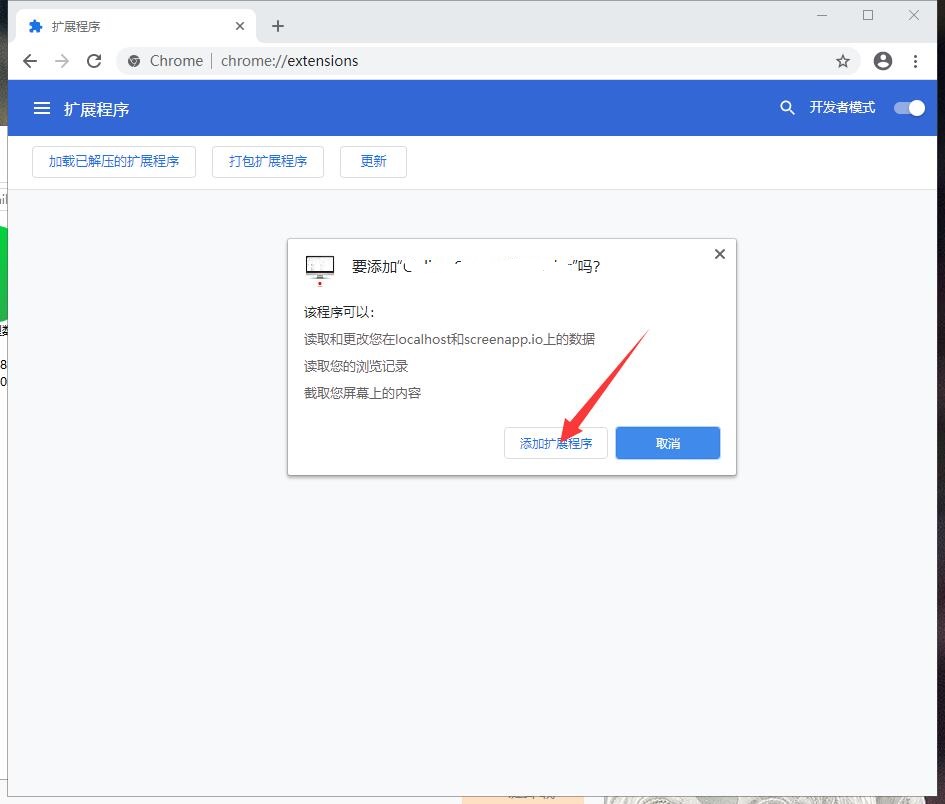
3.找到自己已经下载好的Chrome离线安装文件xxx.crx,然后将其从资源管理器中拖动到Chrome的扩展管理界面中,这时候浏览器会提示要“添加xxx“吗?我们点击”添加扩展程序“即可成功安装插件。
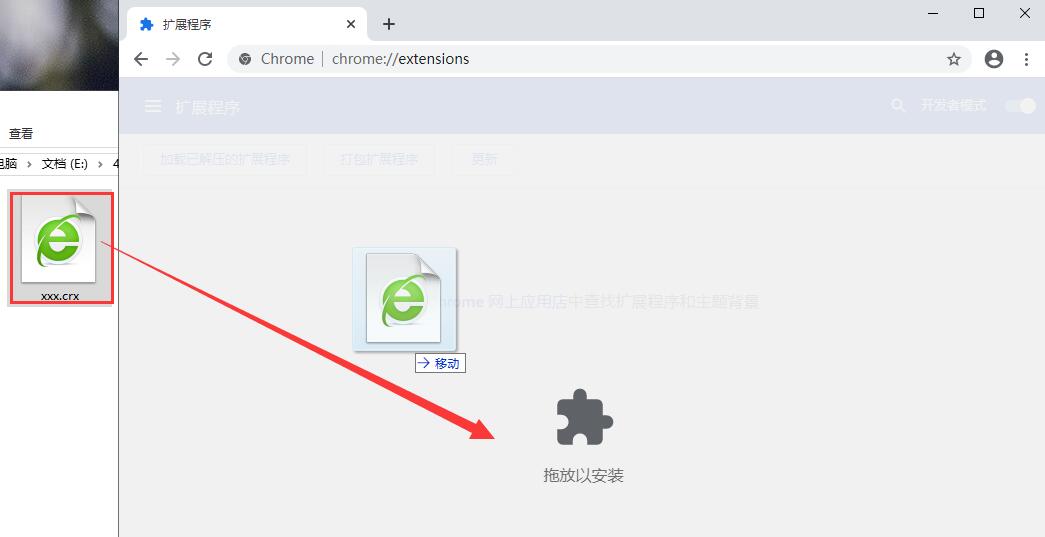
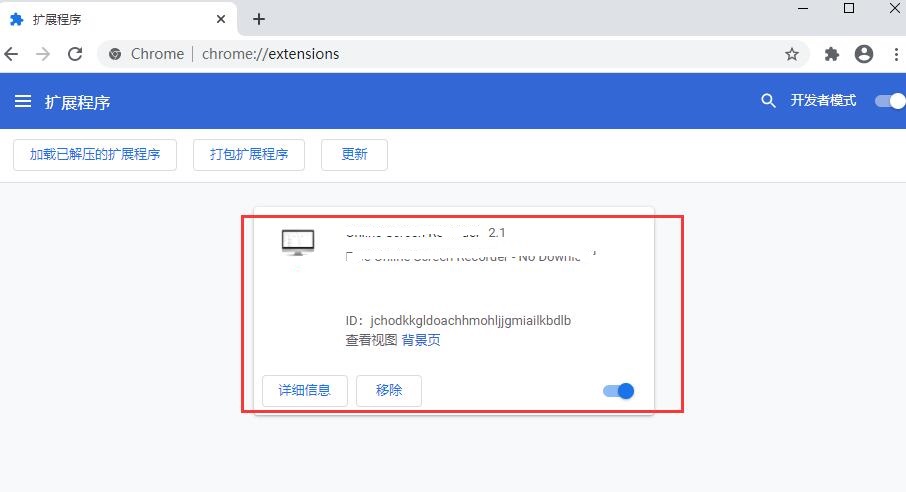
4.显示已经成功安装插件,点击”移除“即可卸载,相当的简便。
Xdebug helper使用说明
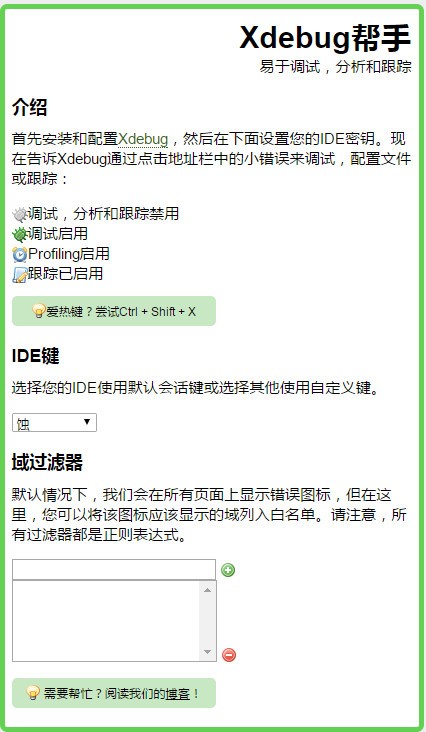
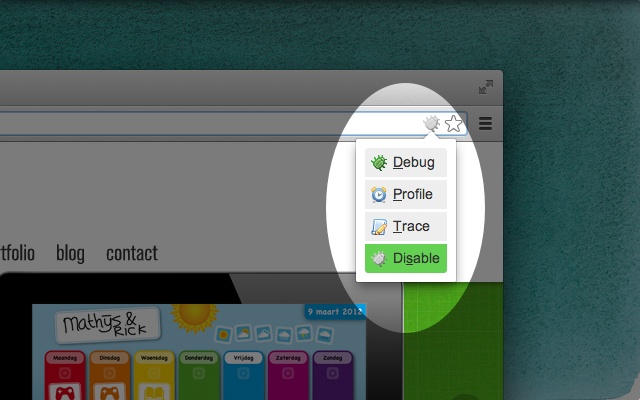
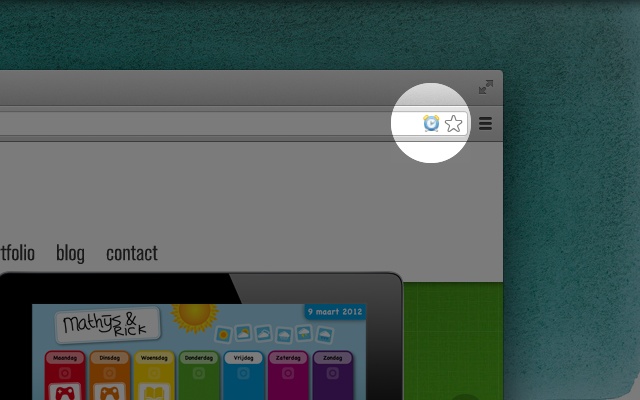
1.安装完成xdebug helper后再浏览器地址栏的右侧能够看到一只小爬虫,点击后如下图所示:

2.选择Debug,就会通知你的开发环境接下来的代码需要开始调试,选择disable,就会直接运行。如下图所示:
3.在xdebug helper中配置它,选择phpstorm并且在右边的框中填入PHPSTORM。
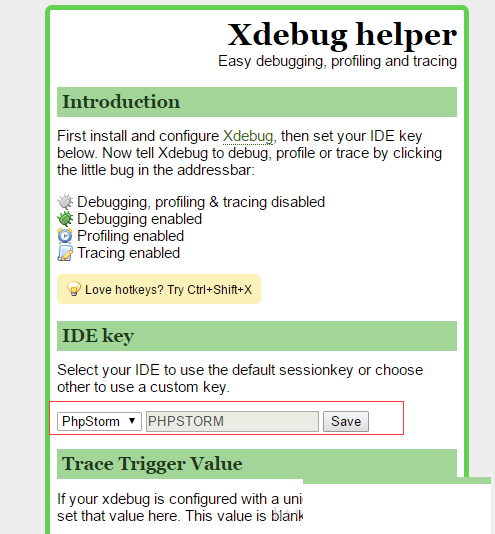
4.到这里所有的配置已经完成了,可以phpstorm中设置断点,然后使用浏览器的xdebug helper开启页面调试。
5.xdebug helper常用热键:
- Ctrl + Shift + X(Mac上的Cmd + Shift + X)打开弹出窗口。
- Alt + Shift + X切换调试状态。
Xdebug helper更新日志
1. 优化的脚步从未停止!
2. 更多小惊喜等你来发现~
小编推荐:
Xdebug helper太好用了,在网络辅助里面算是数一数二的软件,相信用过的小伙伴都会说好用的,如果不喜欢我们还有号码魔方、桌面淘宝、中原银行网银助手、搜狗输入法皮肤盒子、平安银行网银助手
- 三星M2836DW打印机驱动程序
- 映美fp-730k打印机驱动
- Canon佳能打印机驱动程序 for mac
- epson爱普生LQ730K打印机驱动
- 爱普生lq635k打印机驱动程序
- EPSON爱普生lq610k打印机驱动程序64bit
- EPSON爱普生lq610k打印机驱动程序32bit
- 浩顺小票打印机驱动程序
- 佳能E610打印机驱动
- 佳博打印机通用驱动程序
- 佳博gp 系列打印机驱动
- 联想lj2800打印机驱动程序 for WinXp/Win7 64位
- Panasonic松下dp8020P打印机驱动程序 for win7
- doPDF (PDF转换器)
- 佳能lbp5000打印机驱动 (32+64位)
- 中崎打印机驱动
- Aisino Printer Install航天打印机驱动
- 三星ML-2951D打印机驱动 (支持所有Windows)
- 富士施乐打印机p158b驱动
- datamax i4208打印机驱动程序
- datamax i4308 驱动
- 惠普HP1468打印机驱动程序
- 惠普1400打印机驱动(基本驱动程序)
- 64位pdf虚拟打印机(Doro PDF Writer)
- 惠普打印机管理员资源套件(PARK)
- 七日杀弩自动装填MOD v1.0
- 最终幻想7重制版爱丽丝棕色夹克白色草莓裙MOD v2.22
- 泰坦之旅不朽王座八项修改器 V1.47 绿色版
- 虐杀原形2十一项修改器 V1.0 绿色版
- 虐杀原形2六项修改器 V1.0 绿色版
- 真三国无双8帝国金色秘技能全满星超级珠子存档 v2.32
- 星露谷物语更好的祝尼魔MOD v1.0.5
- 恐怖冰淇淋6 v1.0
- 虐杀原形2六项属性修改器 V1.0 绿色版
- 虐杀原形2六项修改器Ac1d版 V1.0 绿色版
- jet ski
- jet stream
- jettison
- jetty
- jetway
- Jew
- jewel
- jewel case
- jewelled
- jeweller
- 白月光
- 妖之女王
- 司南
- 完美不完美
- [网球王子]近畿管区警察局特别警务部
- 雨过天晴
- 绑架之星辰花开
- 当冷酷王子遭遇野蛮灰姑娘
- 我要看你痛苦
- VIP
- [BT下载][对不起青春][全10集][WEB-MKV/21.73G][简繁英字幕][1080P][Netflix][Xiaomi] 剧集 2014 日本 剧情 打包
- [BT下载][立功·东北旧事][第07集][WEB-MP4/0.84G][中文字幕][4K-2160P][H265][Xiaomi] 剧集 2023 大陆 剧情 连载
- [BT下载][立功·东北旧事][第07集][WEB-MP4/0.33G][国语配音/中文字幕][1080P][H265][BlackTV] 剧集 2023 大陆 剧情 连载
- [BT下载][说100万次就好了][第01-05集][WEB-MKV/5.35G][中文字幕][1080P][KKTV] 剧集 2023 日本 爱情 连载
- [BT下载][警视厅局外人][第01-06集][WEB-MKV/6.10G][中文字幕][1080P][KKTV] 剧集 2023 日本 喜剧 连载
- [BT下载][乡村爱情15][全40集][WEB-MP4/21.26G][国语配音/中文字幕][1080P][H265][BlackTV] 剧集 2023 大陆 喜剧 打包
- [BT下载][乡村爱情15][全40集][WEB-MP4/71.89G][国语配音/中文字幕][4K-2160P][60帧率][H265][BlackTV] 剧集 2023 大陆 喜剧 打包
- [BT下载][乡村爱情15][全40集][WEB-MP4/54.58G][国语配音/中文字幕][4K-2160P][H265][BlackTV] 剧集 2023 大陆 喜剧 打包
- [BT下载][心碎情歌][全6集][WEB-MKV/32.76G][简繁英字幕][4K-2160P][H265][Netflix][BlackTV] 剧集 2022 其它 剧情 打包
- [BT下载][心碎情歌][全6集][WEB-MKV/51.98G][简繁英字幕][4K-2160P][HDR][H265][Netflix][BlackTV] 剧集 2022 其它 剧情 打包
- UltraISO软碟通怎样制作U盘系统启动盘?UltraISO软碟通制作U盘系统启动盘的操作教程
- ultraiso怎样提取dmg中ipsw固件?ultraiso提取dmg中ipsw固件方法
- Apex新武器属性怎么样?Apex新武器属性攻略
- Apex英雄怎样预约手游?Apex英雄手游预约攻略
- Apex英雄什么时候上线?Apex英雄上线时间分享
- Apex英雄手机配置有哪些?Apex英雄手机配置介绍
- Apex英雄手游下载地址在哪?Apex英雄手游下载地址介绍
- Apex英雄怎样获取合成金属?Apex英雄获取合成金属的方法
- Apex英雄怎样进行复活?Apex英雄进行复活的攻略
- Apex英雄怎样获取账号箱子?Apex英雄获取账号箱子的操作技巧