网站首页 软件下载 游戏下载 翻译软件 电子书下载 电影下载 电视剧下载 教程攻略 音乐专区
霍普软件下载网-旗舰软件下载站,将绿色免费商业版破解软件、共享软件、游戏、电影、电视剧一网打尽!
| 软件 | mpandroidchartlibrary-2-1-6.jar |
| 分类 | 软件下载 |
| 语言 | 简体中文 |
| 大小 | 0.45MB |
| 版本 | PC版 |
| 下载 |

|
| 介绍 |
mpandroidchartlibrary-2-1-6.jar包是一个Android开源图表库MPAndroidChart的jar包,下载了mpandroidchartlibrary包即可使用后线图和饼图,支持选择、缩放和拖放。  文件预览  使用实例 下面主要实现以下饼状图: 1.下载最新mpandroidchartlibrary.jar包, 然后copy到项目的libs中 2.定义xml文件 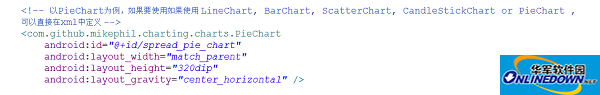 3.主要Java逻辑代码如下,注释已经都添加上了。 package com.jackie.mpandroidpiechart; import java.util.ArrayList; import com.github.mikephil.charting.charts.PieChart; import com.github.mikephil.charting.components.Legend; import com.github.mikephil.charting.components.Legend.LegendPosition; import com.github.mikephil.charting.data.Entry; import com.github.mikephil.charting.data.PieData; import com.github.mikephil.charting.data.PieDataSet; import android.support.v7.app.ActionBarActivity; import android.graphics.Color; import android.os.Bundle; import android.util.DisplayMetrics; public class MainActivity extends ActionBarActivity { private PieChart mChart; @Override protected void onCreate(Bundle savedInstanceState) { super.onCreate(savedInstanceState); setContentView(R.layout.activity_main); mChart = (PieChart) findViewById(R.id.spread_pie_chart); PieData mPieData = getPieData(4, 100); showChart(mChart, mPieData); } private void showChart(PieChart pieChart, PieData pieData) { pieChart.setHoleColorTransparent(true); pieChart.setHoleRadius(60f); //半径 pieChart.setTransparentCircleRadius(64f); // 半透明圈 //pieChart.setHoleRadius(0) //实心圆 pieChart.setDescription("测试饼状图"); // mChart.setDrawYValues(true); pieChart.setDrawCenterText(true); //饼状图中间可以添加文字 pieChart.setDrawHoleEnabled(true); pieChart.setRotationAngle(90); // 初始旋转角度 // draws the corresponding description value into the slice // mChart.setDrawXValues(true); // enable rotation of the chart by touch pieChart.setRotationEnabled(true); // 可以手动旋转 // display percentage values pieChart.setUsePercentValues(true); //显示成百分比 // mChart.setUnit(" €"); // mChart.setDrawUnitsInChart(true); // add a selection listener // mChart.setOnChartValueSelectedListener(this); // mChart.setTouchEnabled(false); // mChart.setOnAnimationListener(this); pieChart.setCenterText("Quarterly Revenue"); //饼状图中间的文字 //设置数据 pieChart.setData(pieData); // undo all highlights // pieChart.highlightValues(null); // pieChart.invalidate(); Legend mLegend = pieChart.getLegend(); //设置比例图 mLegend.setPosition(LegendPosition.RIGHT_OF_CHART); //最右边显示 // mLegend.setForm(LegendForm.LINE); //设置比例图的形状,默认是方形 mLegend.setXEntrySpace(7f); mLegend.setYEntrySpace(5f); pieChart.animateXY(1000, 1000); //设置动画 // mChart.spin(2000, 0, 360); } /** * * @param count 分成几部分 * @param range */ private PieData getPieData(int count, float range) { ArrayList<String> xValues = new ArrayList<String>(); //xVals用来表示每个饼块上的内容 for (int i = 0; i < count; i++) { xValues.add("Quarterly" + (i + 1)); //饼块上显示成Quarterly1, Quarterly2, Quarterly3, Quarterly4 } ArrayList<Entry> yValues = new ArrayList<Entry>(); //yVals用来表示封装每个饼块的实际数据 // 饼图数据 /** * 将一个饼形图分成四部分, 四部分的数值比例为14:14:34:38 * 所以 14代表的百分比就是14% */ float quarterly1 = 14; float quarterly2 = 14; float quarterly3 = 34; float quarterly4 = 38; yValues.add(new Entry(quarterly1, 0)); yValues.add(new Entry(quarterly2, 1)); yValues.add(new Entry(quarterly3, 2)); yValues.add(new Entry(quarterly4, 3)); //y轴的集合 PieDataSet pieDataSet = new PieDataSet(yValues, "Quarterly Revenue 2014"/*显示在比例图上*/); pieDataSet.setSliceSpace(0f); //设置个饼状图之间的距离 ArrayList<Integer> colors = new ArrayList<Integer>(); // 饼图颜色 colors.add(Color.rgb(205, 205, 205)); colors.add(Color.rgb(114, 188, 223)); colors.add(Color.rgb(255, 123, 124)); colors.add(Color.rgb(57, 135, 200)); pieDataSet.setColors(colors); DisplayMetrics metrics = getResources().getDisplayMetrics(); float px = 5 * (metrics.densityDpi / 160f); pieDataSet.setSelectionShift(px); // 选中态多出的长度 PieData pieData = new PieData(xValues, pieDataSet); return pieData; } } 效果图如下: 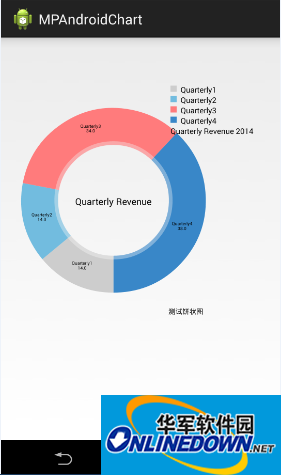 主要是一些基本属性和API的调用,具体每个API都有什么样的效果和作用,只能靠自己去尝试。后面还会陆陆续续为大家介绍MPAndroidChart其他类型的图表。 |
| 截图 | |
| 随便看 |
|
免责声明
本网站所展示的内容均来源于互联网,本站自身不存储、不制作、不上传任何内容,仅对网络上已公开的信息进行整理与展示。
本站不对所转载内容的真实性、完整性和合法性负责,所有内容仅供学习与参考使用。
若您认为本站展示的内容可能存在侵权或违规情形,请您提供相关权属证明与联系方式,我们将在收到有效通知后第一时间予以删除或屏蔽。
本网站对因使用或依赖本站信息所造成的任何直接或间接损失概不承担责任。联系邮箱:101bt@pm.me